Project Description
(This description is taken from our NSF proposal. For a simpler explanation, see the "San Acacia Project at a Glance" box on the home page)
We have a unique and powerful biological system for this analysis, consisting of a pocket gopher and chewing louse assemblage that we have been studying for nearly 25 years. In this system, one species of louse has been undergoing a documented range expansion that dates back at least to the 1920's. We have a library of louse samples collected since 1991 and have demonstrated a yearly southward movement of the parasite’s geographic distribution of ~200m/yr. Thus, we have a rich data set with which to test models regarding the genetics of population expansion and genetic recovery. Because our study will use time-series empirical data rather than space-for-time data to test predictions made in simulation studies, and because we combine population genetics and genomics, this study has the potential to change the way researchers think about (and model) the genetics of range expansion. Our study expands the role of a model system within systematics (cophylogeny in pocket-gophers and their chewing lice) to potentially become a model system for studying the evolutionary processes of populations over long time periods. In addition, it may well add to our understanding of the spread of parasites and disease among hosts. Therefore, our research straddles many traditional NSF programs (and even Clusters) such as systematics, evolutionary genetics/ecology and population ecology and even contains a long-term study component. Because of the cross-cutting nature of our proposed work and the potential to yield transformative data that changes the way future researchers think about traditional model systems, parasites, range shifts, and expanding populations, our research has the potential for broad impact.
III. Project
1. Conceptual Framework—Geographic range expansion occurs following speciation events, when species become invasive due to habitat alteration, when exotic forms are introduced, and sometimes when climate changes (Wegmann et al. 2006). Given recent interest in landscape genetics and genetic structure of threatened populations, it is important to understand the effect of changing geographic distribution on genetic diversity. In recent years, the impact of range expansion has received increasing attention in the form of modeling in simulated populations under a variety of conditions, yielding testable hypotheses regarding the spatial and temporal apportionment of genetic variation (Excoffier et al. 2009; François et al. 2010; Arenas et al. 2011; Slatkin& Excoffier 2012; Peischl et al. 2013).
In this study, we will test hypotheses regarding the genetics of geographic range expansion using molecular data from a species of parasitic chewing louse. Several recent studies have examined spatial patterns of genetic diversity from natural populations that have experienced recent or ongoing range expansions (e.g., Garciá et al. 2013; Knutsen et al. 2013; Swaegers et al. 2013; White et al. 2013), but none of these has included historical samples, and none have focused on parasite species, which provide interesting biological similarities to stepping-stone colonization models. Over the past 24 years, we have measured the ongoing range expansion of this parasite species as it colonizes a new subspecies of pocket gopher host (Demastes 1990; Demastes 1996; Demastes et al. 1998; Hafner et al., 1998). We will test three different hypotheses relating to geographic range expansion using specimens from our collections made at the colonization zone nearly 25 years ago (about 270 louse generations; Rust 1974), 20 years ago (~220 generations), and 15 years ago (~160 generations) coupled with contemporary collections at multiple sites. In short, this parasite species will provide real-time genetic data that we will use to test predictions of geographic range expansion derived from simulation and space-for-time substitution studies.
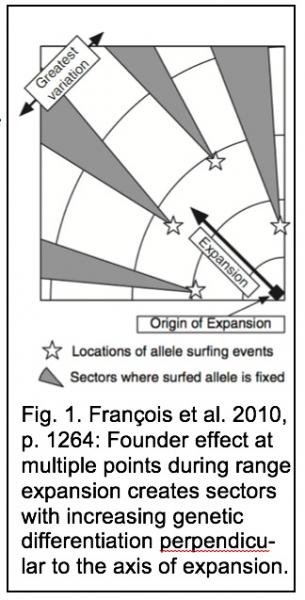
Predictions based on simulations of expanding populations have established genetic drift as a potent force in geographically expanding populations, because the expansion process itself results from a series of founder events (population bottlenecks) moving through geographic space (Excoffier & Ray 2008). As a result of genetic drift, an expected signature of expanding populations is decreasing heterozygosity with increasing geographic distance from the source population (e.g., Austerlitz et al. 1997; Slatkin & Excoffier 2012; Garciá et al. 2013; White et al. 2013), but this pattern depends on the rate of population growth (Roques et al. 2012). Other signatures of expanding populations can include a unimodal mismatch distribution, star-shaped gene genealogies, an excess of rare alleles, and an excess of homozygosity relative to the number of observe alleles (Excoffier 2004; Excoffier et al. 2009). The concept of “allele surfing” (Klopfstein et al. 2006) has emerged as having key explanatory power in modeled populations experiencing geographic range expansion. Surfing allows rare alleles in a population to reach high frequency through repeated founder events and to be more widespread at the expanding periphery of the population (the wave front), where population density is especially low (Excoffier & Ray 2008). Therefore, the point at which an allele is most common is not necessarily its place of origin (Edmonds et al. 2004). Because surfing is stochastic in nature and can occur at multiple points along an advancing wave of population e, sectors of low diversity will form that are genetically differentiated from neighboring sectors if migration among demes is somewhat restricted (Excoffier & Ray 2008). Thus, surfing leads to high levels of genetic structure in geographically expanding populations, with the greatest genetic diversity on an axis perpendicular to the axis of population expansion (Fig. 1; François et al. 2010). Importantly, this patchy distribution of allele frequencies can persist for hundreds of generations (Ibrahim et al. 1996).
 Background—We are testing hypotheses that predict the genetic consequences of organismal range shifts by expanding our long-term research to focus on the shifting geographic range of Geomydoecus aurei, a species of parasitic chewing louse that is in the process of displacing a congener (Demastes 1990; Demastes 1996; Demastes et al. 1998; Hafner et al. 1998). Geomydoecus aurei and its congener (G. centralis) are found in New Mexico along the Rio Grande Valley, where they are parapatric (Fig. 2: inset). These lice belong to different species groups (Price & Hellenthal 1981), and nuclear data indicate that they are not hybridizing (Hafner et al. 1998).
Geomydoecus lice are highly host-specific, obligate parasites of pocket gophers. They are wingless and their entire life cycle is spent on their host. Pocket gophers are solitary burrow dwellers. Thus, louse transmission is restricted by specializations and behaviors of both lice and their hosts (Hafner et al. 2003). Restricted dispersal from one host to another is evident in allozyme, mtDNA sequence, and microsatellite data from lice in the form of high FST and significant AMOVA values (Nadler et al. 1990; Nessner et al. accepted; Harper et al. in prep). For example, Thomomydoecus minor is a chewing louse that is not undergoing a range expansion, but that does coexist on the same hosts along with our study species (G. aurei). AMOVA analyses of microsatellite and mtDNA sequence data both indicate that, while the proportion of genetic variation that is accounted for by differences among infrapopulations of T. minor is small, it is highly significant (p<0.0001). Microsatellite data FST values average 0.05 (ranging from 0.01 to 0.10) among contemporaneous infrapopulations of T. minor collected from the same place, with nearly all comparisons being significantly different from zero after correction for multiple tests. A pattern of restricted gene flow among pocket-gopher chewing louse infrapopulations also has been documented in two congeners of our study species (G. actuosi allozyme data, Nadler et al., 1990 and G. ewingi microsatellite data, Nessner et al., accepted). Thus, all louse individuals of the same species on a single host can be treated as a population in our analyses. In all, we have available 203 historical louse populations, with intensive sampling concentrated along and perpendicular to the axis of population expansion (north-south vs. east-west, respectively; generalized collecting localities shown in Fig. 2). Precise collection sites of all historic samples of individual pocket gophers were mapped at the time of their collection.
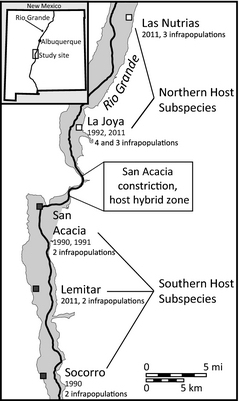 The louse species of interest in our study are found on two subspecies of the pocket gopher Thomomys bottae that meet and hybridize to a limited extent (Smith et al. 1983). The northern pocket gopher subspecies meets the southern subspecies at a physiographic constriction along the Rio Grande, and this constriction appears to have held the hybrid zone in place over many years (Hafner et al. 1998). Given the host specificity that chewing lice normally show, one might expect the two Geomydoecus species to meet at the same place the two host subspecies meet. However, the two louse species meet well south of the host hybrid zone (wave fronts in Fig. 2), indicating a host switch by G. aurei from the northern host subspecies to the southern host subspecies (Demastes et al. 1998). Hafner et al. (1998) describe in detail evidence indicating that G. aurei has been advancing southward onto a new host subspecies since the last major flooding of the valley in 1929 (Hafner et al. 1998). In 1991, the two louse species met approximately 6 km south of the host hybrid zone; in 1996, they met 700 m farther south (Hafner et al. 1998); and in 2001, they met another 1,000 m farther south of the host hybrid zone (Fig. 2). Therefore, our data document southward expansion of the northern species of louse at a fairly consistent rate of 140-200 m per year.
Acquisition of 2015-2016 lice, in conjunction with our historical samples (maintained in -80°C storage), will allow us to compare the genetics of leading-edge and core populations of G. aurei over a 25 year time span (~270 louse generations), making this study a goldmine of data for testing models of population expansion.
3. Hypotheses—We are testing 3 models derived from simulations of spatial expansion using a geographically expanding parasite, treating lice from each individual host as a separate population:
- The linear model of spatial expansion (Austerlitz et al. 1997) predicts that leading-edge populations will show greater evidence of bottlenecks than core populations, and thus will be progressively more differentiated from populations closer to the origin of expansion. We will test this hypothesis by comparing the genetic structure of leading-edge populations to those closer to the core; evidence contrary to the above prediction will falsify the linear-model hypothesis as it pertains to this system and will support the potential influence of an Allee effect, which can preserve diversity at the wave front (Roques et al. 2012). Our proposed and past sampling will allow us to do 3 temporal pseudoreplicates of this experiment (Table 1). In addition, because we have documented a consistent 140-200 m/yr southward migration of G. aurei in the Rio Grande valley of New Mexico, our sampling provides real-time (as opposed to simulated) tests of probabilistic inference programs such as MIGRATE (Beerli 2006) that are designed to distinguish panmixia from cases of unambiguous migration direction among populations (Beerli & Palczewski 2010). MIGRATE and related gene-flow models, if reliable, should detect signal of southward migration in G. aurei.
- The allele-surfing model (François et al. 2010) predicts that expanding populations will show greater genetic variation along an axis perpendicular to the axis of expansion than along an axis parallel to it (Fig. 1). We will analyze 3 temporal pseudoreplicates of this experiment (Table 1), comparing differentiation in east-west samples vs. differentiation in north-south samples for each time period.
- Simulations by Ibrahim et al. (1996) lead to the prediction that formerly bottlenecked populations at the leading edge of range expansion will be slow to recover from bottleneck events and retain evidence of the event hundreds of generations after initial colonization. We will test the recovery-time model by comparing the genetic structure of populations at 3 different stages of recovery (Table 1).
Table 1. Sampling strategy for tests of range expansion models for G. aurei populations.
Comparisons to be Made (temporal pseudoreplicates)
Model 1 (linear model of spatial expansion):
- 1991 wave front vs. 1991 core localities farther north
- 2001 wave front vs. 2001 core localities farther north
- 2015 wave front vs. 2015 core localities farther north
Model 2 (surfing model):
- Parallel to axis of expansion vs. perpendicular to axis of expansion (1991)
- Parallel to axis of expansion vs. perpendicular to axis of expansion (1996)
- Parallel to axis of expansion vs. perpendicular to axis of expansion (2015)
Model 3 (recovery time model):
- 1991 wave front vs. 2015 sample at same locality (ca. 270 generations later)
- 1996 wave front vs. 2015 sample at same locality (ca. 220 generations later)
- 2001 wave front vs. 2015 sample at same locality (ca. 160 generations later)
Research Approach—We have extensive experience collecting gophers and their lice, all necessary permits, and the equipment necessary for this work. With NSF funding, we will locate the current position of the contact zone (predicted 2015 position, Fig. 2) and collect intensively both parallel to and perpendicular to the region of louse population expansion. Additionally, we will sample at a site well north of the zone of expansion and re-sample the geographic localities where the colonization zones existed in 1991, 1996, and 2001 (Fig. 2), which are now embedded within the range of G. aurei. This sampling strategy will allow temporal comparisons of present-day populations to samples from the same populations collected during each of the three past sampling periods (both parallel and perpendicular sampling was done in the past), resulting in a rare time-series study opportunity and allowing robust testing of hypotheses concerning spatial and temporal apportionment of genetic variation (Table 1). Maximum width of suitable habitat at the predicted zone of contact is 2-3 km (Hafner et al. 1998), and sampling will be carried out to ensure complete coverage, as it was in past years. While the proposed research does not directly address the exact mechanism of range expansion (e.g., parasite dispersal and habitat [host] availability), this largely ecological question lies outside the scope of this population genetic work and may be more tractable once information on the genetic interactions of these difficult-to-observe organisms is available as a result of funding for this small-grant proposal.
We will use microsatellites and mitochondrial (mtDNA) sequences to perform our genetic comparisons. We will genotype at least 25 lice per population (i.e., per host; Hale et al. 2012). Using lice that we collected in 2012 (Fig. 2), we have constructed a microsatellite library and have studied in detail eight polymorphic microsatellite loci specific to G. aurei using seed grant money. Additional loci have been described for the genus Geomydoecus by co-PI Light (Nessner et al. 2014; article). Developing a sufficient number of population-level markers for G. aurei is a priority, and funding will enable us to continue our library work until we can select at least 15 polymorphic loci (He > 0.3) with highly reproducible scoring patterns to genotype G. aurei. Additionally, we have sequenced a 600 bp region of the mtDNA COI gene for 21 G. aurei lice from both sides of the host hybrid zone. Based on an observed 1.2% sequence divergence, we propose to sequence the entire COI minicircle chromosome (2,306 bp; Pietan et al. 2016; article) for each individual to construct a dataset with sufficient variation to permit analysis using summary statistics and coalescent-based techniques (e.g., mismatch distributions).
Descriptive statistics will be generated by Genepop (Raymond & Rousset 1995), Fstat (Goudet 1995), and Arlequin (Excoffier et al. 2000). DnaSP (Librado & Rozas 2009) will be used to calculate mismatch distributions, Fu’s FS, and Tajima’s D. We will use programs and approaches such as STRUCTURE (Pritchard et al. 2000), Geneland (Guillot et al. 2005), AMOVA, PCA, FS, and FST analysis to consider hypotheses of population structure, M-ratio (or M_P_val; Garza & Williamson 2001) and Bottleneck (Cornuet & Luikart 1996; Piry et al. 1999) for hypotheses concerning population stability, MIGRATE (Beerli 2006) and IMa (Hey & Nielsen 2004, 2007) to assess migration, the directionality index for range expansion (Peter and Slatkin 2013), and BEAST skyline plots (Drummond & Rambaut 2007), SPLATCHE 2 (Ray et al. 2010), and LAMARC (Kuhner 2006) to detect population expansion. Because our study explores different response variables for Model 1 (i.e., allelic richness) and Model 2 (i.e., population subdivision), and given the moving nature of the zone, which dictates that only a partially overlapping set of samples will be used to address each model, our statistical options exclude multivariate approaches. Our models are not necessarily mutually exclusive and we likely could find some support for all three range-expansion models.