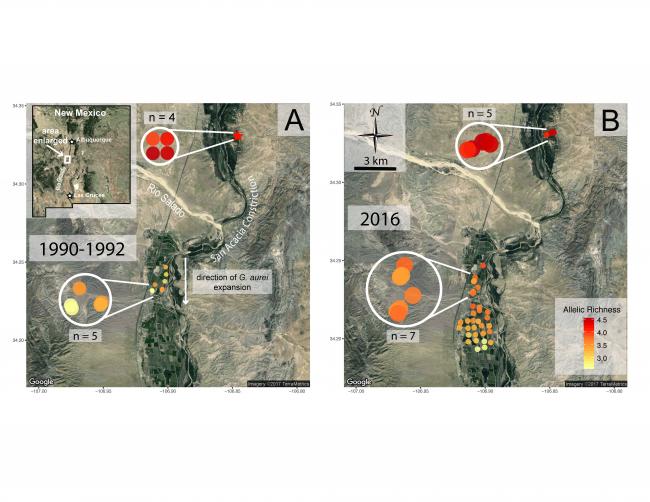
Map of Allelic Richness
Infrapopulations of G. aurei (mean N = 30 lice per colored circle) sampled along the Rio Grande Valley of New Mexico in (A) 1990-1992 and (B) 2016. Outside the valley and where the green, irrigated valley is narrowed (the San Acacia constriction of the Rio Grande Valley) , pocket gopher habitat is extremely limited and patchy, restricting host introgression (Smith et al. 1983) and opportunities for louse dispersal. However, G. aurei has expanded its range southward across this constriction likely in the last 100 years (Hafner et al. 1998). In 2016, the southern limit of the species distribution (southernmost circles of B) was approximately 3.5 km farther south than in 1990-1992 (southernmost circles of A), indicating an average southward movement of G. aurei of 140 m per year. Color indicates allelic richness (AR) with dense red indicating maximum AR, which occurs in populations in the core of the G. aurei distribution and with color becoming progressively more dilute as AR decreases in the newly invaded portions of the species range.
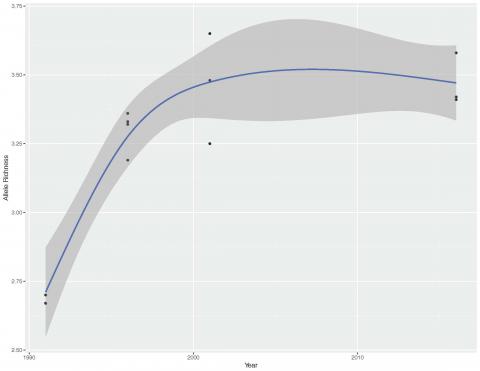
Infrapopulation allelic richness over time at a single collection site with regression line (and 95% confidence belts for the line) drawn using a generalized additive model to compensate for the non-linear relationship between time for recovery and allelic richness (F = 19.7 R2 = 0.84, P < 0.001). Populations sampled in 1991 were collected soon after the initial establishment of G. aurei at site T3 (Fig. 1). Genetic recovery from the initial population bottleneck began quickly (in the first 5 years or 45 louse generations), but then tapered off without reaching the level of genetic diversity observed in infrapopulations of lice from the core of the species distribution at last sampling 25 years (225 louse generations) after population establishment.
Spatial analyses of allele frequencies in infrapopulations of G. aurei south of the San Acacia constriction, where the species has recently expanded its range. (A) Principal components analysis (PCA) and (B) spatial PCA (sPCA) results for principal component 1 (PC 1) mapped over geography (sampling shown in Fig. 1). Size and color of boxes indicate infrapopulation eigenvalues along PC 1. Lines between boxes show Delaunay triangulation connection grids used in Monmonier and sPCA analyses. Jagged gray lines indicate results of Monmonier barrier analysis with thickness of the line showing relative magnitude of genetic distance. Boundary box of (B) indicates the infrapopulations included in FST analysis between groups identified by sPCA and Monmonier as different. The east-west partitioning of genetic diversity detected by each of these analyses is consistent with surfing alleles.